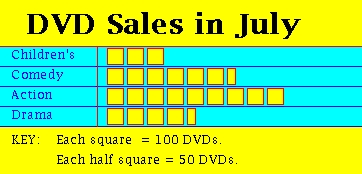
From this pictograph for DVD sales during July we can see:
Sometimes we use pictographs instead of tallies to display information.
Study the following example:
From this pictograph for DVD sales during July we can see:
Based on this pictograph we could answer questions such as:
   1) How many more Drama DVDs were sold than Children's DVDs?
      ANSWER: 450 - 300 = 150.

   2) How many more Action DVDs were sold than Comedy DVDs?
      ANSWER: 900 - 650 = 250.

   3) How many Comedy or Action DVDs were sold in all?
      ANSWER: 650 + 900 = 1550.
Here's another example:
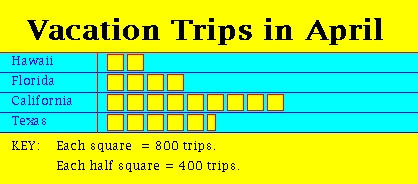
From this pictograph for vacation trips during April we can see:
Based on this pictograph we could answer questions such as:
   1) How many more people traveled to Texas than Florida?
      ANSWER: 4400 - 3200 = 1200.

   2) How many more people went to California than Hawaii?
      ANSWER: 7200 - 1600 = 5600.

   3) How many people traveled to Texas or Florida?
      ANSWER: 4400 + 3200 = 7600.