This chart shows some information about the vegetables served in the Trona cafeteria.
Here's another pie graph for you to inspect.
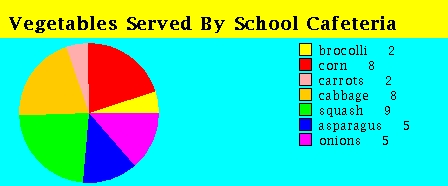
This chart shows some information about the vegetables served in the Trona
cafeteria.
Using this chart we can answer questions like:
  1) Which vegetable is served the most often?
     ANSWER: squash

  2) Which two vegetables are served the least often?
     ANSWER: brocolli and carrots

  3) How many more times cabbage served than onions?
     ANSWER: 8 - 5 = 3